Joyce
July 2011 MLS Report
David’s Comments –
I am real pleased to say that we have some good news. Average sold price is up 1.9% over last month, is up 4.5% over Year end 2010 and up 2.1% over July 2010 and up 9.8% over July 2009. We are up 38 sold units over July 2010. Current listing inventory is down by 2.2% from last month and the sellers paid concessions is higher than last month. The average sold price is up $4,506 over last month and up $4,936 from last July. Our sold units hit 403 an decrease of 78 units from last month. Our numbers exceed last July. On August 1 we saw a decrease of 109 homes in our listing inventory; we have 4,739 homes on the market as of August 1st. This adjusted our month’s supply with just over 11.7 months and increase from last month’s 10.4. Our average list price has continued a small increase each month since the start of the year; we are currently at $352,859. In July sellers paid concessions in about 31.5% of all the month’s transactions about 2% higher than last month. Our average days on the market decreased to 162 days. The list to sold ratio has increased a little to 94.8% this number needs to continue to get better. The number of homes that sold in 15 days or less continues to remain very low, 10.9% of July sold homes. The 30-year fixed-rate mortgage (FRM) averaged 4.32% with an average 0.7 points for the week ending August 11, 2011. We have seen decreases the last 2 weeks. Call me so I can show you or your clients how they can get the benefit of these rates. Have a great week and let me know what I can do to help you and your clients.
Despite all the media comments about our markets we are still lending money for residential mortgages. If a client has income and credit and some sort of down payment; they can get a mortgage. It goes to the basic three C’s – Capacity, Collateral and Character.
Listing Inventory
In July we saw a decrease in listing inventory by 109 units from last month. We are about 861 units under August 1, 2010. We have 4,739 single family homes for sale in our MLS. The average list price of $352,859 is up by $881 from last month about +.03%. This is the highest we have seen since December 2010. In the last 6 months our average listing price has ranged from $342,123 to $353,465. This is the first summer that we have not had an inventory that exceeded 5,000 units; we have to go back to 2005 & 2006 when our inventory was this low. Please note the consistent winter dip in listings – see chart below.

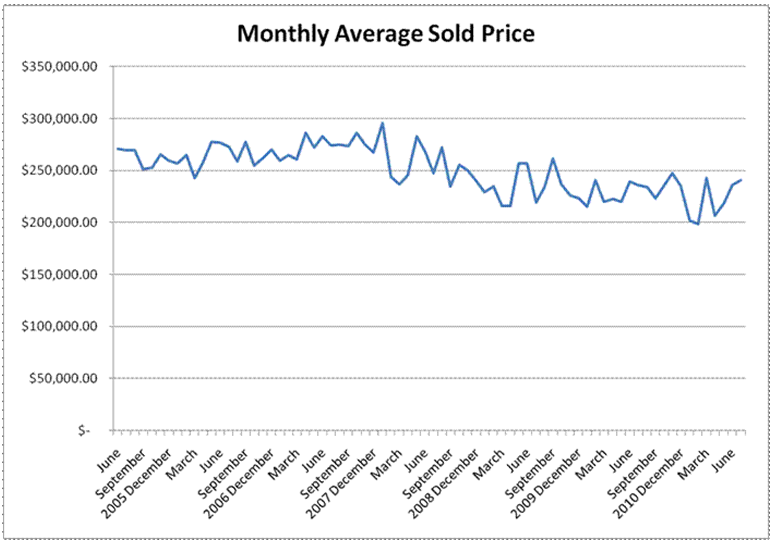
Monthly Average Sold Price
July average sold price ($240,845) shows an increase of 1.9% from last month and up 2.1% from July 2010 and up 9.8% from July 2009. What a great month. Our monthly average sold price is up $4,506 from last month and up $4,936 from July 2010 and up $21,527 from July 2009. Our average sales price is climbing. The gaps are getting closer. July’s average sold price is 4.5% ahead of our yearend sales price of $230,508. From April to July we have an average sales price increase of 16.4%. These are all good signs for our market.
Monthly Sold Units
We are down 78 sold units (16.2%) from June 2011 and up 38 units from July 2010. We are down 48 sold units from July 2009. This July we are up by 10.4% in units sold compared to July 2010, a good month. Last June was our peak month in sold units for 2010; currently our sold units for June 2011 are 481 the best month of 2011 so far. We continue our up down journey with sold units.

Average Sold Price Year to Date
Year over year our year to date numbers have dipped a little.
2003 year end average sale price $ 186,137
2004 year end average sale price $ 210,048
2005 year end average sale price $ 254,080
2006 year end average sale price $ 264,498
2007 year end average sale price $ 273,408
2008 year end average sale price $256,498
2009 year end average sale price $234,379
2010 year to date average sale price $230,508
Our current Year to date average sold price - $223,490 about -3.0% down from Year End 2010

Rolling 12 months
Our rolling 12 months gives us a better look at our production. It helps to smooth out a month that jumps up and down. When we look at August 1st, 2010 to July 31, 2011 we have 4,484 sold units and when we compare the year prior August 1st, 2009 to July 31, 2010 we have a 284 unit decrease (4,768 sold units). When we look at the same rolling 12 months for average sold price we see that we are only down by 1.7%. So the dates of 8/1/2010 to 7/31/2011 we have an average sold price of $227,955 while from 8/1/2009 to 7/31/2010 we had an average sold price $231,794. Like I have already said our gaps are getting closer.
Median Sold Price
Our Median sold price increased this month by 1.4% from last month. Our national numbers lag by one month. Our median sales price continues its jagged path – up then down then up and now we start an upward trend. On a National scale the economy is trying to improve, for the first time in many years we have the National Median home sales price cross over our current median sales price. I am hoping we have seen the last dip in Median on a National scale and local level.

Pending
Pending Sales – A sale is listed as pending when the contract has been signed but the transaction has not yet closed. Sales are typically finalized within one to two months from signing. I am counting Active Due Diligence and pending contracts in my total pending sales. I look at the total pending units on a regular basis and this is how they chart out. Our pending index seems to go back on a slight downward trend. In December we bottomed out about 575 units, we have since rebounded and peaked out in June. We currently have 760 pending sales as of 8/13/11.

Market Absorption rate – The number of homes sold in July, 403 divided by the current listing inventory, 4,739 gives us an 11.7 month supply of single family homes. This increased by 1.3 months from last month. We need to keep this inventory under 12 months supply. With rates where they are and plenty of inventory; we can get this number down even more.
List to Sold price ratio – the average list price of the sold properties is $254,093 and the average sold price is $240,845 for July which gives us a 94.8% list to sold price ratio – an increase from last month. We have now managed to stay under 95% for over a year and several months. I want to quit counting the number of months and get this trend reversed. This is one of the lowest ratio’s we have had in a while.
Seller Concessions – We had 31.5% of sold properties report a sales concession for July, an increase of 2%. We want this number to go lower.
Days on Market – The average days on market for the sold properties are now at 162 for July (wow that is a long time) a 3 day decrease from last month. That is about 5 1/2 months to keep a property on the market. Only 10.9% of the properties were placed under contract in less than 15 days for the month of July.
Carolina & Kure Beach
There are currently 371 single family homes for sale and this represents a change of 11 units from July 1, 2011 and 7.8% of our total WRAR inventory. The average list price is $384,379 an increase of about $2,854 from July 1, 2011. In July there were 30 homes sold, divide that by the homes available and you have a 12.3 monthly supply of homes in Carolina and Kure Beach. The average sold price for the month of June was $286,548 and down by $6,066 from last month. Current year to date we are ahead of last year by $7,517 – our year to date sold price is $300,631 and compared to 2010 at $293,114 we are up 2.6%. When we look at a rolling 12 months for Carolina & Kure Beach we are up by 41 units and our sold prices are down by 2.0% from the previous rolling 12 months.
This data was pulled on August 13, 2011, based on information from the Wilmington Regional Association of REALTORS Incorporated, for the period Jan. 1, 2005 through July 31, 2011.
The Market
Market Concerns Produce New Record Low Mortgage Rates
Freddie Mac released the results of its Primary Mortgage Market Survey®, showing mortgage rates continuing to decline with the 30-year fixed averaging 4.32 percent marking a new low for 2011, and the 15-year fixed, 5-year ARM, and 1-year ARM averaging new all-time record lows this week.
30-year fixed-rate mortgage (FRM) averaged 4.32 percent with an average 0.7 point for the week ending August 11, 2011, down from last week when it averaged 4.39 percent. Last year at this time, the 30-year FRM averaged 4.44 percent.
15-year FRM this week averaged 3.50 percent with an average 0.7 point, down from last week when it also averaged 3.54 percent. A year ago at this time, the 15-year FRM averaged 3.92 percent.
Average commitment rates should be reported along with average fees and points to reflect the total cost of obtaining the mortgage. Visit the following links for Regional and National Mortgage Rate Details and Definitions.
Quotes
Attributed to Frank Nothaft, vice president and chief economist, Freddie Mac.
"Renewed market concerns about the European debt markets led investors to shift funds into U.S. Treasuries, pushing long-term yields lower. Further, in its August 9th Federal Open Market Committee statement, the Federal Reserve noted that economic growth so far this year had been considerably slower than it expected and that overall labor market conditions had deteriorated in recent months, leading the Committee to conclude that an exceptionally low federal funds rate should be maintained at least through mid-2013. These developments helped to ease mortgage rates lower this week.
"Lower mortgage rates will help to maintain the high degree of home-buyer affordability in the market. The National Association of Realtors® reported that its affordability index over the past three quarters has indicated the highest affordability since the inception of the index in 1970."
Freddie Mac
30 Year Fixed Rates

I offer these key statistics to keep you informed as to how our market is changing. With 23 years of real estate sales and management and finance in my background I am able to evaluate the current conditions and provide you with accurate data. With key information from your clients I can evaluate their needs and offer them the best plan for their current mortgage. With our current “Buyer Ready” program we can shorten the due diligence period and take the qualifying fear away from the client. Call me today for a worksheet.
Cunningham & Company is a full service Mortgage Banker - we handle everything in house. We do first time buyers, USDA, FHA and VA loans, Conventional and Jumbo Loans, 100% financing and we have a large selection of adjustable rate loans. Call me today with my background in real estate and the resources of Cunningham & Company working together... you can't miss. A loan in the crowd.
David Flory NMLS #91592


